Examining string vibrations
About this lesson plan
This is a lesson plan for indented for realization during 2h lesson activities.
It has been developed during work in iCSE4school project based on lesson carried out in 2015-2017 at The Stefan Batory High School in Chorzów.
It was prepared by Adam Ogaza based on his lesson.
Attention!
In each of the “code” cells you can change any number, text or instruction. In order to return to the original version refresh the webpage. Sometimes the next code depends on variables defined from the previous one, so one has to execute cells in order of apperance.
Introduction
The aims of lesson:
Experimental determination the dependence of frequency on the length of the string.
Use Python to carry out the graphical data analysis.
Educational aids:
String stretched on a ruler / resonance box / any string instrument
Acoustic generator
Loudspeaker
Phone application measuring frequency of sound
Phone application generating sound of a given frequency
Used methods:
Preliminary computer exercises in drawing plots in Python and fitting straits and curves to experimental data.
Lecture - as a theoretical introduction.
Exercises in groups - measurements of vibration frequencies for string of different lengths.
This lesson is addressed to students of age 17, learning at advanced level. It fulfills the following requirements included in National Curriculum:
General requirement V: “planning and executing simple experiments and analyzing their results”.
Detailed requirement 6.8: “student uses in calculations the relations between wave parameters: length, frequency, period and velocity”
Detailed requirement 6.12: “student describes standing waves and their dependence on waves running backwardly”.
Intersection requirement 12.2: “student single-handedly makes correct graphs”.
Intersection requirement 12.5: “student fits a straight line y = ax + b to the graph and calculates the coefficients a and b”.
Experimental requirement 13.6: “student examines string vibrations (for example the dependence of frequency on the length), does the measurements, description, data analysis and graph interpretation”
The described topic is a simple example of a perfect integration science with IT and teaching English. Therefore it must be carried out both in computer laboratory, physics laboratory and English class-room.
IT Part
The experimental lesson must be preceded by a basic course of Python, including drawing and formatting graphs and fitting functions to measuring points. Polish National Curriculum requires only fitting straight lines y = ax + b and counting the coefficients a and b. Python allows to fit any curve without any effort, so it is a good opportunity to play with hyperbola. The additional skills needed to complete the homework assigned at the end of experimental lesson are: formatting text in SAGE, inserting pictures and making tables in the text. It is advisable to perform with students the following exercises:
Insert any photo into SAGE document:
Create and format a hypothetical table:
LP. |
1 |
2 |
3 |
4 |
5 |
6 |
7 |
8 |
9 |
l |
5 |
10 |
15 |
20 |
30 |
40 |
50 |
70 |
90 |
y |
1750 |
879 |
589 |
444 |
309 |
243 |
185 |
122 |
99 |
Create and decorate a dot diagram of it.
Tabular output of data (instead of print)
Fit a hyperbola to above points
Assume, that l represents the length of string and y stands for the frequency. Draw the graph T(l), where T is the period and fit a straight line to it. Examine, whether forcing the straight to go through the origin of coordinates changes much.
Experimental Part
At the beginning the teacher ask pupils to recall the ideas of standing waves, frequency, wave length and phase velocity. Next, he derives the formula f ( l ), where l is the length of string. It shows, that this two variables are inversely proportional. Checking this dependence is the main aim of this lesson.
Next, students are divided into groups. Each group chooses one instrument. It may be a string stretched on a ruler, string stretched on a resonance box or any real music string instrument. Groups move far away each from other to minimize the mutual disturbance.
In each group somebody is responsible for putting the string into vibrations. Simultaneously, somebody else generates sound using software generator. It has a property of fluent adjusting the frequency. When the group judge, that the tone coming out from the loudspeaker is the same as from the string, they note the length of string and frequency. This measurement is repeated for different length of the oscillator, in the most possible range. Alternatively, students may make independent measurements, using software applications in their smartphones.
All collected data are noted in a table in notebooks. Students are encouraged to make photos. The teacher announces, that this data and photos will be used in a homework.
Homework
Write in SAGE a short report of the executed experiment, including description of the essence of the matter, measuring system (with photo), used tools, performed activities, obtained results and inferences. In particular, the report should prove or refute the hypothesis, that frequency of vibrations is reciprocally proportional to the length of string.
The data are shared for the whole groups, but all reports must be independent and individual. The authors of best reports will have the right to translate their works into English and publish them, gaining additional points for it. English teachers are ready to assist and supervise pupils in translation.
Evaluation Report
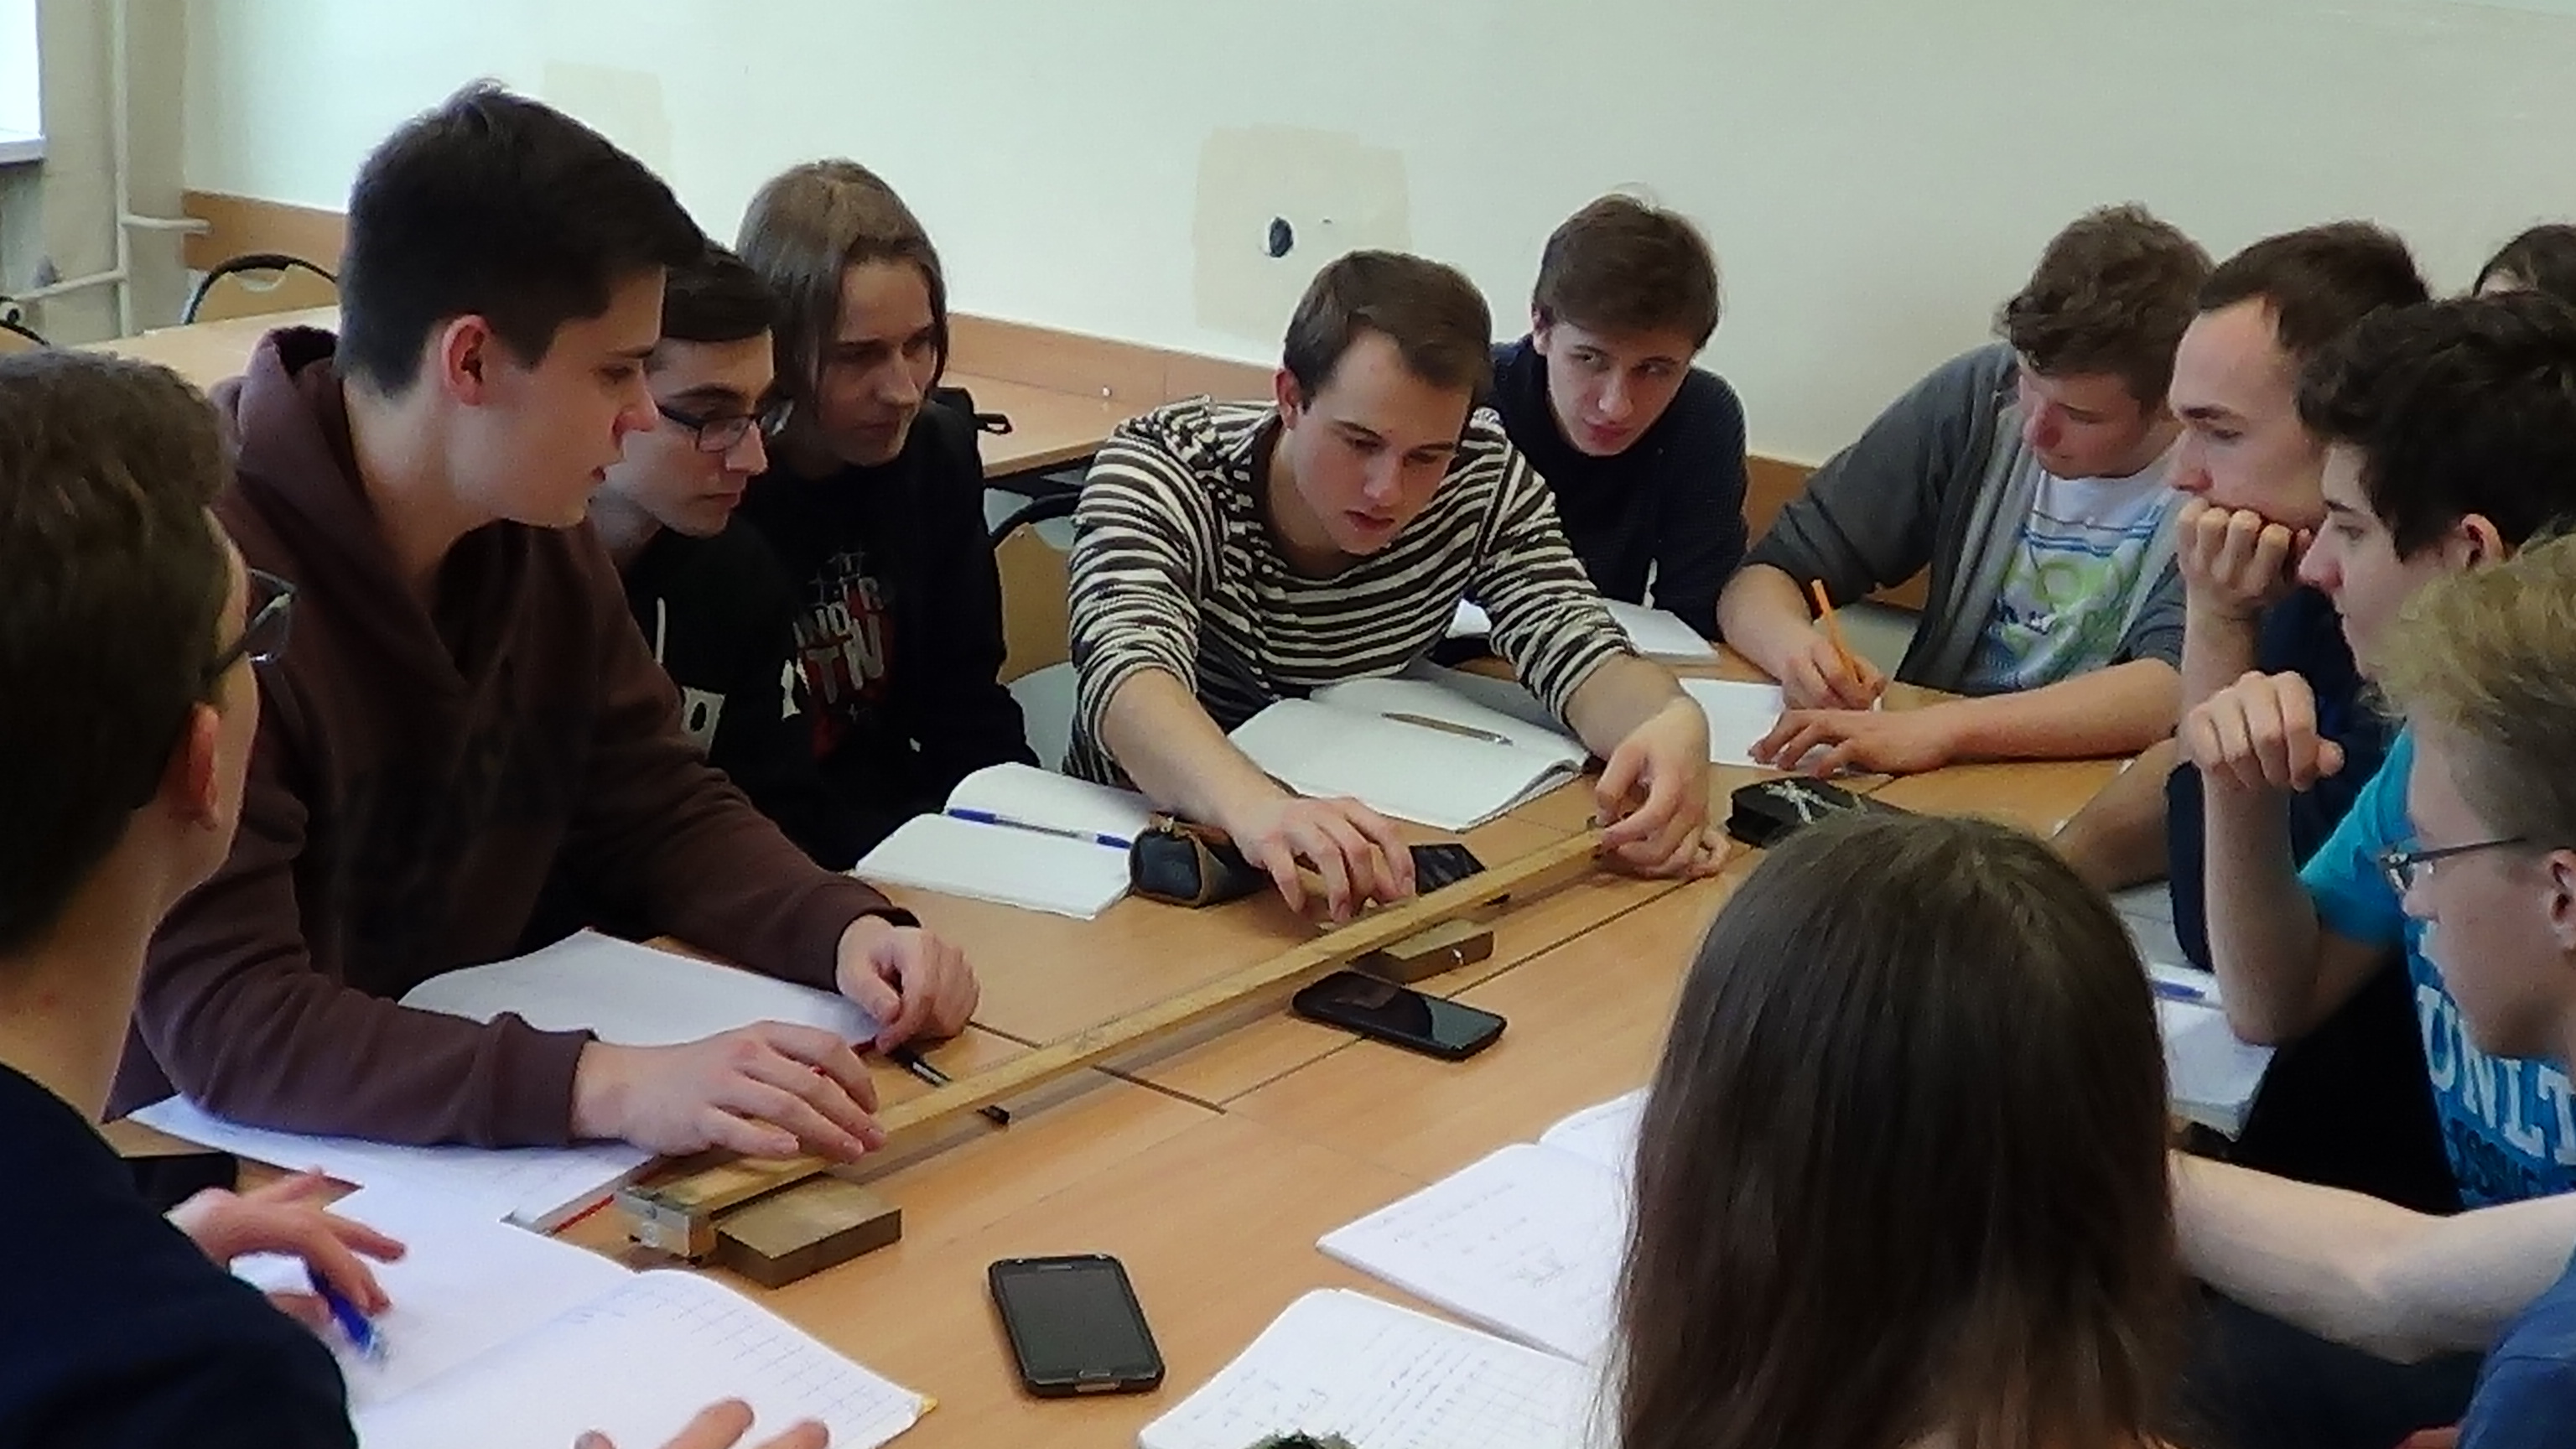
At first time this lesson was carried out in the spring 2015. All students made the same measurement. The whole group (14 person) is visible in the above picture. All homeworks were based on the same set of data, but I asked students to work individually at home and create unique reports. In fact, obtained reports differed in level and tools used. Students usually admitted, that using Sage helped them much. They discovered that Sage is a convenient environment for that tasks.
The second edition of the lesson Examining String Vibrations was accomplished 5-th April 2016 (both IT and experimental parts). Students were divided into 5 groups of four people each. One girl brought her own violin, somebody else used her own guitar. The remaining 3 groups were equipped with instruments from my laboratory, i.e. a string stretched on resonance box and two strings stretched on a ruler. All groups were equipped with software acoustic generators and applications measuring the dominant frequency of heared sound. Some groups stayed in the classroom, whereas the others went to corridor to carry out their measurements far away from noises generated by other groups.
After tentative calculations it occurred, that 4 groups succeeded in their measurements, whereas one encountered disturbances by voices coming from the neighbor group. They asked me to repeat this experiment during additional classes. Finally, all students obtained reasonable results and wrote quite good reports.
After two weeks we met again in the IT laboratory. By this time I had made a preliminary assessments of the works. I explained my remarks and advised, what could be improved. After next week I set the final assessments. Five works got the highest grades and moved on to the second step. Their authors were granted a possibility to translate the works into English and publish them for extra points. Earlier I asked English teacher for cooperation. They supervised the translations and also made their own assessments of the language. All the awarded homeworks are published at sage01 server.
This lesson was a great success. Students liked it very much. I managed to integrate physics not only with IT, but also with English. Language teachers appreciated my initiative and reported, that it was an interesting experience both for them and for the students. They teach a subject called technical English for engineers and this was its live, practical application.
I will not describe the individual student’s conclusions, because they are all included in the original works.
The last edition (in April 2017) was the most successfull. Next generation of students became skilled in attaching errorbars to graphs, using Numpy library. Some of them brought their own professional music equipment and made really serious scientific investigation. Like one year earlier, I qualified the best works for translation, which students did on their own perfect. The best homeworks are attached in separate files.
Work 1, Polish version: https://sage01.icse.us.edu.pl/home/pub/184/
Work 1, English version: https://sage01.icse.us.edu.pl/home/pub/179/
Work 2, Polish version: https://sage01.icse.us.edu.pl/home/pub/170/
Work 2, English version: https://sage01.icse.us.edu.pl/home/pub/172/